дёҖдёӘ JVM еҸӮж•°еј•еҸ‘зҡ„йў‘з№Ғ CMS GC
еүҚиЁҖдәҶи§Ј CMS GC зҡ„еҗҢеӯҰ пјҢ дёҖе®ҡзҹҘйҒ“ -XX:CMSScavengeBeforeRemark еҸӮж•° пјҢ е®ғжҳҜз”ЁжқҘејҖеҗҜжҲ–е…ій—ӯеңЁ CMS-remark йҳ¶ж®өд№ӢеүҚзҡ„жё…йҷӨпјҲYoung GCпјүе°қиҜ• гҖӮ
еӨ§е®¶йғҪзҹҘйҒ“CMS GC еҸӘдјҡеӣһ收 OldGen зҡ„еҜ№иұЎ пјҢ йӮЈдёәд»Җд№ҲйңҖиҰҒиҝҷдёӘеҸӮж•°пјҹз”ұдәҺ YoungGen еӯҳеңЁеј•з”Ё OldGen еҜ№иұЎзҡ„жғ…еҶө пјҢ еӣ жӯӨ CMS-remark йҳ¶ж®өдјҡе°Ҷ YoungGen дҪңдёә OldGen зҡ„ вҖңGC ROOTSвҖқ иҝӣиЎҢжү«жҸҸ пјҢ йҳІжӯўеӣһ收дәҶдёҚиҜҘеӣһ收зҡ„еҜ№иұЎ гҖӮ иҖҢй…ҚзҪ® -XX:+CMSScavengeBeforeRemark еҸӮж•° пјҢ еңЁ CMS GC зҡ„ CMS-remark йҳ¶ж®өејҖе§ӢеүҚе…ҲиҝӣиЎҢдёҖж¬Ў Young GC пјҢ жңүеҲ©дәҺеҮҸе°‘ Young Gen еҜ№ Old Gen зҡ„ж— ж•Ҳеј•з”Ё пјҢ йҷҚдҪҺ CMS-remark йҳ¶ж®өзҡ„ж—¶й—ҙејҖй”Җ гҖӮ
иҝҷзҜҮж–Үз« зҡ„еҶ…е®№жҳҜдёҡеҠЎејҖеҸ‘еҗҢеӯҰйҒҮеҲ°зҡ„еҘҮжҖӘзҡ„йў‘з№Ғ CMS GC й—®йўҳ пјҢ жҲ‘们дёҖиө·е®ҡдҪҚжҺ’жҹҘ пјҢ жңҖз»ҲеҸ‘зҺ°и·ҹ -XX:CMSScavengeBeforeRemark еҸӮж•°зӣёе…і гҖӮ
й—®йўҳйў‘з№Ғ Full GCдёҡеҠЎејҖеҸ‘еҗҢеӯҰйҖҡиҝҮзӣ‘жҺ§еҸ‘зҺ°зәҝдёҠдёҖеҸ°жңәеҷЁйў‘з№Ғ CMS GC пјҢ дёӢеӣҫжҳҜ CMS GC зӣ‘жҺ§еӣҫ пјҢ еӨ§зәҰд»Һ 20 зӮ№ 5-15 еҲҶ пјҢ жҜҸеҲҶй’ҹ 8-11 ж¬Ўзҡ„жҢҒз»ӯ CMS GC гҖӮ
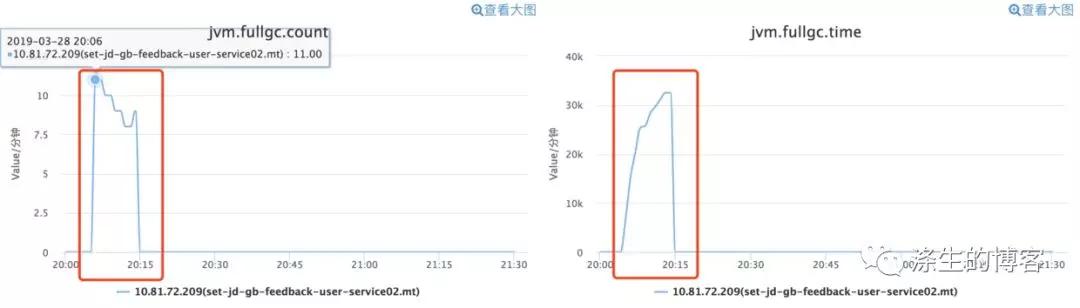 ж–Үз« жҸ’еӣҫ
иҜҙжҳҺпјҡе…¬еҸёзӣ‘жҺ§еҜ№ Old GC дёҺ Full GC жҳҜдёҚеҢәеҲҶзҡ„ пјҢ жЎҲдҫӢдёӯи®Ізҡ„е…¶е®һжҳҜ CMS GC гҖӮ
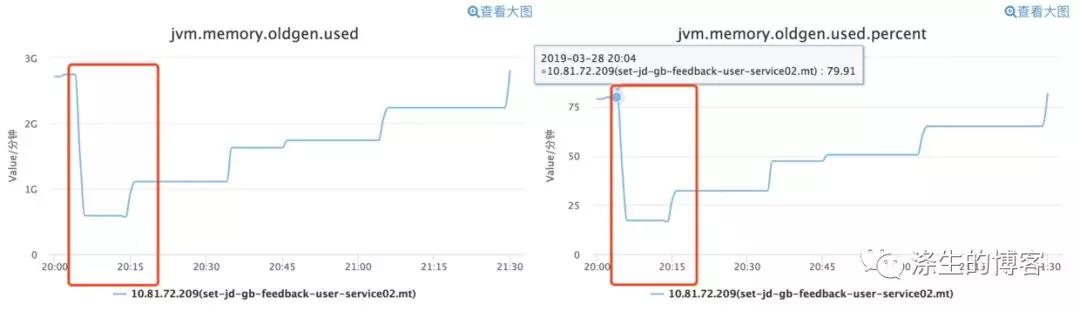
OldGen дҪҝз”Ёз©әй—ҙеҚ жҜ”д»ҺдёӢеӣҫ OldGen зҡ„дҪҝз”Ёзӣ‘жҺ§еӣҫжқҘзңӢ пјҢ еҲҡејҖе§Ӣ OldGen еҜ№иұЎеҚ з”Ё OldGen зәҰ 80% зҡ„з©әй—ҙ пјҢ з»ҸиҝҮ CMS GC еҗҺ пјҢ еҮ д№Һз«Ӣ马з©әй—ҙдҪҝз”Ёзҡ„еҚ з”ЁжҜ”дҫӢзәҰеңЁ 30% д»ҘдёӢ гҖӮ
 ж–Үз« жҸ’еӣҫ
//JDK зүҲжң¬ "1.8.0_45"-Xms5324m -Xmx5324m -Xss512k -XX:PermSize=384m -XX:MaxPermSize=384m -XX:MetaspaceSize=256m -XX:MaxMetaspaceSize=256m -XX:NewSize=2048m -XX:MaxNewSize=2048m -XX:SurvivorRatio=8 -XX:MaxTenuringThreshold=9 -XX:+UseConcMarkSweepGC -XX:+UseCMSInitiatingOccupancyOnly -XX:+CMSScavengeBeforeRemark -XX:+ScavengeBeforeFullGC -XX:+UseCMSCompactAtFullCollection -XX:+CMSParallelRemarkEnabled -XX:CMSFullGCsBeforeCompaction=9 -XX:CMSInitiatingOccupancyFraction=80 -XX:+CMSClassUnloadingEnabled -XX:SoftRefLRUPolicyMSPerMB=0 -XX:-ReduceInitialCardMarks -XX:+CMSPermGenSweepingEnabled -XX:CMSInitiatingPermOccupancyFraction=80 -XX:+ExplicitGCInvokesConcurrent -XX:+PrintGCDetails -XX:+PrintGCDateStamps -XX:+PrintGCApplicationConcurrentTime -XX:+PrintGCApplicationStoppedTime -XX:+PrintHeapAtGC -Xloggc:/data/applogs/heap_trace.txt -XX:-HeapDumpOnOutOfMemoryError -XX:HeapDumpPath=/data/applogs/HeapDumpOnOutOfMemoryError -XX:+IgnoreUnrecognizedVMOptions з»“еҗҲ OldGen зҡ„дҪҝз”Ёз©әй—ҙеҚ жҜ”дёҺ JVM еҸӮж•°пјҲ-XX:+UseCMSInitiatingOccupancyOnly -XX:CMSInitiatingOccupancyFraction=80пјү пјҢ еҮ д№ҺеҸҜд»Ҙж–ӯе®ҡ第дёҖж¬Ў CMS GC жҳҜеӣ дёә OldGen зҡ„дҪҝз”ЁеҚ жҜ”еҲ°иҫҫдәҶ OldGen жҖ»йҮҸзҡ„ 80% гҖӮ
з–‘жғ‘第дёҖж¬Ўи§ҰеҸ‘ CMS GC еҸҜд»ҘйҖҡиҝҮ OldGen зҡ„дҪҝз”ЁеҚ жҜ”еҲ°иҫҫдәҶ OldGen жҖ»йҮҸзҡ„ 80% жқҘи§ЈйҮҠ пјҢ дҪҶжҳҜйҖҡиҝҮзӣ‘жҺ§еҸҜд»ҘзңӢеҲ°еҗҺжқҘ OldGen дҪҝз”ЁеҚ жҜ”йҷҚдҪҺеҲ° 30% д»ҘдёӢ пјҢ дёәд»Җд№ҲиҝҳдёҖзӣҙйў‘з№ҒиҝӣиЎҢ CMS GCпјҹ
еҲҶжһҗGC зӣ‘жҺ§еӣҫеұ•зӨәзҡ„иҝҳдёҚеӨҹе…Ёйқў пјҢ е…·дҪ“й—®йўҳиҝҳжҳҜиҰҒйҖҡиҝҮ GC ж—Ҙеҝ—иҝӣиЎҢе®ҡдҪҚ пјҢ еӣ дёә GC ж—Ҙеҝ—дёӯзҡ„дҝЎжҒҜжӣҙдё°еҜҢ гҖӮ
GC ж—Ҙеҝ—дёәдәҶеҲҶжһҗй—®йўҳ пјҢ иҝҷйҮҢйҖүеҸ–дәҶ第дёҖж¬ЎгҖҒ第дәҢж¬ЎгҖҒ第дёүж¬Ў-第 N ж¬Ўзҡ„ CMS GC ж—Ҙеҝ— гҖӮ
第дёҖж¬Ў CMS GCж—Ҙеҝ—
2019-03-28T20:05:06.906+0800: 3644459.373: [GC (CMS Initial Mark) [1 CMS-initial-mark: 2935428K(3354624K)] 3160044K(5242112K), 0.0586708 secs] [Times: user=0.22 sys=0.00, real=0.06 secs]2019-03-28T20:05:06.965+0800: 3644459.432: Total time for which application threads were stopped: 0.0616049 seconds, Stopping threads took: 0.0001381 seconds2019-03-28T20:05:06.965+0800: 3644459.432: [CMS-concurrent-mark-start]2019-03-28T20:05:08.066+0800: 3644460.533: [CMS-concurrent-mark: 1.101/1.101 secs] [Times: user=1.57 sys=0.05, real=1.10 secs]2019-03-28T20:05:08.066+0800: 3644460.533: [CMS-concurrent-preclean-start]2019-03-28T20:05:08.076+0800: 3644460.543: [CMS-concurrent-preclean: 0.010/0.010 secs] [Times: user=0.01 sys=0.01, real=0.01 secs]2019-03-28T20:05:08.076+0800: 3644460.543: [CMS-concurrent-abortable-preclean-start]2019-03-28T20:05:10.177+0800: 3644462.645: Application time: 3.2124140 seconds{Heap before GC invocations=18476 (full 731): par new generationtotal 1887488K, used 1887488K [0x0000000673400000, 0x00000006f3400000, 0x00000006f3400000)eden space 1677824K, 100% used [0x0000000673400000, 0x00000006d9a80000, 0x00000006d9a80000)from space 209664K, 100% used [0x00000006e6740000, 0x00000006f3400000, 0x00000006f3400000)tospace 209664K,0% used [0x00000006d9a80000, 0x00000006d9a80000, 0x00000006e6740000) concurrent mark-sweep generation total 3354624K, used 2935428K [0x00000006f3400000, 0x00000007c0000000, 0x00000007c0000000) Metaspaceused 90225K, capacity 91504K, committed 91776K, reserved 1130496Kclass spaceused 9517K, capacity 9806K, committed 9856K, reserved 1048576K2019-03-28T20:05:10.179+0800: 3644462.647: [GC (Allocation Failure) 3644462.647: [ParNew: 1887488K->201195K(1887488K), 0.4228807 secs] 4822916K->3279195K(5242112K), 0.4231546 secs] [Times: user=1.54 sys=0.00, real=0.42 secs] Heap after GC invocations=18477 (full 731): par new generationtotal 1887488K, used 201195K [0x0000000673400000, 0x00000006f3400000, 0x00000006f3400000)eden space 1677824K,0% used [0x0000000673400000, 0x0000000673400000, 0x00000006d9a80000)from space 209664K,95% used [0x00000006d9a80000, 0x00000006e5efae68, 0x00000006e6740000)tospace 209664K,0% used [0x00000006e6740000, 0x00000006e6740000, 0x00000006f3400000) concurrent mark-sweep generation total 3354624K, used 3078000K [0x00000006f3400000, 0x00000007c0000000, 0x00000007c0000000) Metaspaceused 90225K, capacity 91504K, committed 91776K, reserved 1130496Kclass spaceused 9517K, capacity 9806K, committed 9856K, reserved 1048576K}2019-03-28T20:05:10.603+0800: 3644463.070: Total time for which application threads were stopped: 0.4258929 seconds, Stopping threads took: 0.0001722 seconds2019-03-28T20:05:10.904+0800: 3644463.372: [CMS-concurrent-abortable-preclean: 2.397/2.828 secs] [Times: user=6.22 sys=0.10, real=2.83 secs]2019-03-28T20:05:10.904+0800: 3644463.372: Application time: 0.3012271 seconds2019-03-28T20:05:10.907+0800: 3644463.374: [GC (CMS Final Remark) [YG occupancy: 434406 K (1887488 K)]{Heap before GC invocations=18477 (full 731): par new generationtotal 1887488K, used 434406K [0x0000000673400000, 0x00000006f3400000, 0x00000006f3400000)eden space 1677824K,13% used [0x0000000673400000, 0x00000006817bed10, 0x00000006d9a80000)from space 209664K,95% used [0x00000006d9a80000, 0x00000006e5efae68, 0x00000006e6740000)tospace 209664K,0% used [0x00000006e6740000, 0x00000006e6740000, 0x00000006f3400000) concurrent mark-sweep generation total 3354624K, used 3078000K [0x00000006f3400000, 0x00000007c0000000, 0x00000007c0000000) Metaspaceused 90225K, capacity 91504K, committed 91776K, reserved 1130496Kclass spaceused 9517K, capacity 9806K, committed 9856K, reserved 1048576K2019-03-28T20:05:10.907+0800: 3644463.375: [GC (CMS Final Remark) 3644463.375: [ParNew (promotion failed): 434406K->315478K(1887488K), 5.8407801 secs] 3512406K->3486710K(5242112K), 5.8410096 secs] [Times: user=6.84 sys=1.31, real=5.84 secs]Heap after GC invocations=18478 (full 731): par new generationtotal 1887488K, used 315478K [0x0000000673400000, 0x00000006f3400000, 0x00000006f3400000)eden space 1677824K,13% used [0x0000000673400000, 0x00000006817bed10, 0x00000006d9a80000)from space 209664K,39% used [0x00000006e6740000, 0x00000006eb796e60, 0x00000006f3400000)tospace 209664K,95% used [0x00000006d9a80000, 0x00000006e5efae68, 0x00000006e6740000) concurrent mark-sweep generation total 3354624K, used 3171231K [0x00000006f3400000, 0x00000007c0000000, 0x00000007c0000000) Metaspaceused 90225K, capacity 91504K, committed 91776K, reserved 1130496Kclass spaceused 9517K, capacity 9806K, committed 9856K, reserved 1048576K}3644469.216: [Rescan (parallel) , 0.3096135 secs]3644469.525: [weak refs processing, 0.0009228 secs]3644469.526: [class unloading, 0.0797710 secs]3644469.606: [scrub symbol table, 0.0229535 secs]3644469.629: [scrub string table, 0.0020416 secs][1 CMS-remark: 3171231K(3354624K)] 3486710K(5242112K), 6.2593934 secs] [Times: user=8.10 sys=1.36, real=6.26 secs]2019-03-28T20:05:17.166+0800: 3644469.634: Total time for which application threads were stopped: 6.2622888 seconds, Stopping threads took: 0.0002099 seconds2019-03-28T20:05:17.167+0800: 3644469.634: [CMS-concurrent-sweep-start]2019-03-28T20:05:17.176+0800: 3644469.644: Application time: 0.0100218 seconds2019-03-28T20:05:17.179+0800: 3644469.647: Total time for which application threads were stopped: 0.0025500 seconds, Stopping threads took: 0.0001934 seconds2019-03-28T20:05:18.179+0800: 3644470.647: Application time: 1.0001731 seconds2019-03-28T20:05:18.182+0800: 3644470.649: Total time for which application threads were stopped: 0.0026811 seconds, Stopping threads took: 0.0001358 seconds2019-03-28T20:05:21.000+0800: 3644473.468: Application time: 2.8185985 seconds2019-03-28T20:05:21.003+0800: 3644473.471: Total time for which application threads were stopped: 0.0029238 seconds, Stopping threads took: 0.0001172 seconds2019-03-28T20:05:21.013+0800: 3644473.481: Application time: 0.0097451 seconds2019-03-28T20:05:21.019+0800: 3644473.487: Total time for which application threads were stopped: 0.0060990 seconds, Stopping threads took: 0.0002775 seconds2019-03-28T20:05:21.734+0800: 3644474.201: Application time: 0.7144315 seconds2019-03-28T20:05:21.736+0800: 3644474.204: Total time for which application threads were stopped: 0.0026804 seconds, Stopping threads took: 0.0001238 seconds2019-03-28T20:05:22.203+0800: 3644474.671: [CMS-concurrent-sweep: 5.019/5.037 secs] [Times: user=5.28 sys=0.27, real=5.03 secs]2019-03-28T20:05:22.204+0800: 3644474.671: [CMS-concurrent-reset-start]2019-03-28T20:05:22.211+0800: 3644474.678: [CMS-concurrent-reset: 0.007/0.007 secs] [Times: user=0.01 sys=0.00, real=0.01 secs]2019-03-28T20:05:22.238+0800: 3644474.706: Application time: 0.5016696 seconds2019-03-28T20:05:22.241+0800: 3644474.708: Total time for which application threads were stopped: 0.0026876 seconds, Stopping threads took: 0.0001305 seconds2019-03-28T20:05:22.438+0800: 3644474.905: Application time: 0.1970764 seconds2019-03-28T20:05:22.440+0800: 3644474.908: Total time for which application threads were stopped: 0.0027034 seconds, Stopping threads took: 0.0001344 seconds2019-03-28T20:05:23.441+0800: 3644475.908: Application time: 1.0001304 seconds2019-03-28T20:05:23.443+0800: 3644475.911: Total time for which application threads were stopped: 0.0024875 seconds, Stopping threads took: 0.0001316 seconds2019-03-28T20:05:24.210+0800: 3644476.678: Application time: 0.7671567 seconds
жҺЁиҚҗйҳ…иҜ»


- еҫ®иҪҜEdgeиҝҺжқҘдёҖдёӘж–°зҡ„жө®еұӮиҸңеҚ• з”ЁдәҺз®ЎзҗҶдёӢиҪҪиҝӣеәҰ
- й»‘йІЁ4proд»Җд№Ҳж—¶еҖҷеҮәеӨҡе°‘й’ұпјҢй»‘йІЁ4proд»·ж јеҸӮж•°д»Ӣз»Қ
- зәўзұіk40proе’Ңiqooneo3е“ӘдёӘеҘҪжҖ§д»·жҜ”й«ҳ еҸӮж•°еҜ№жҜ”еҢәеҲ«иҜ„жөӢ
- дёҖеҠ йҰ–ж¬ҫеҸҜз©ҝжҲҙи®ҫеӨҮOnePlus Bandж¶ҲжҒҜжұҮжҖ»пјҡд»·ж јгҖҒеҸӮж•°гҖҒеҠҹиғҪе…ЁжҸӯз§ҳ
- дёҖдёӘдә®зӮ№и§ЈиҜ» еҲӣз»ҙе°Ҹж№ғP3 Proеҝ…йЎ»иҰҒд№°зҡ„зҗҶз”ұ
- иҚЈиҖҖV40жӯЈејҸеҫ—еҲ°зЎ®и®ӨпјҒеҸӮж•°й…ҚзҪ®д№ҹеҹәжң¬зЎ®е®ҡпјҒе”®д»·жҲ–е°ҶжҳҜжғҠе–ң
- еҚҺдёәи®ӨиҜҒHCIP-GaussDB-OLTPеҸ‘еёғпјҢдёӢдёҖдёӘй«ҳзә§DBAдјҡжҳҜдҪ еҗ—
- еҸҲй»„дёҖдёӘAPPпјҢвҖңе“ҒзүҢ收иҙӯжңәвҖқжҲҗвҖңжІЎиҗҪ收еүІжңәвҖқпјҢ收дёҖй»„дёҖ
- ж•ҷдҪ з”ЁSiriжқҘжҺ§еҲ¶з”өи„‘пјҡзңҹйҰҷ
- еҚҺдёәз•…дә«20seе’Ңзәўзұіnote9е“ӘдёӘеҘҪеҢәеҲ«еңЁе“Ә еҸӮж•°еҜ№жҜ”иҜ„жөӢ