Python数据分析:数据可视化实战教程( 四 )
 文章插图
文章插图
#按天取两种类型用户平均值number_pei=day_df[['casual','registered']].mean()number_peicasual 517.411765registered 2171.067031dtype: float64#绘制饼图plt.axes(aspect='equal')plt.pie(number_pei, labels=['casual','registered'], autopct='%1.1f%%', pctdistance=0.6 , labeldistance=1.05 , radius=1 )plt.title('Casual or registered in the total lease')Text(0.5,1,'Casual or registered in the total lease')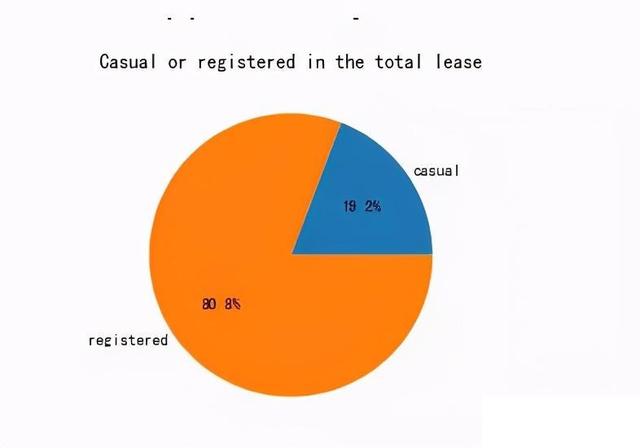 文章插图
文章插图
总结
- 要清楚自己想表达什么 , 有了明确的问题 , 选择合适的图形 , 然后按照需求从整体数据中选择自己需要的数据 , 查阅资料了解函数的参数设置 , 最后完成图形的绘制
- matplotlib是python绘图的基础 , 也是其他拓展包的基础 , 认真学习matplotlib的常用图形和参数是很有必要的
推荐阅读


- 西部数据在CES 2021推出多款4TB容量的旗舰级SSD
- WhatsApp收集用户数据新政惹众怒,“删除WhatsApp”在土耳其上热搜
- 计算机专业大一下学期,该选择学习Java还是Python
- 想自学Python来开发爬虫,需要按照哪几个阶段制定学习计划
- 未来想进入AI领域,该学习Python还是Java大数据开发
- 黑客窃取250万个人数据 意大利运营商提醒用户尽快更换SIM卡
- 阳狮报告:4成受访者认为自己的数据比免费服务更有价值
- 中消协点名大数据网络杀熟 反对利用消费者个人数据画像
- 学习大数据是否需要学习JavaEE
- 意大利运营商Ho Mobile被曝数据泄露