е°ұвҖңиҝҮж»ӨвҖқиҖҢиЁҖ пјҢ жҲ‘们жңүеҫҲеӨҡзұ»еһӢзҡ„иҝҮж»ӨеҷЁ гҖӮ жҜ”еҰӮжЁЎзіҠж»Өй•ңгҖҒй”җеҢ–ж»Өй•ңгҖҒеҸҳдә®гҖҒеҸҳжҡ—гҖҒиҫ№зјҳжЈҖжөӢзӯүж»Өй•ң гҖӮ
дёӢйқўз”ЁдёҖдәӣд»Јз ҒзүҮж®өжқҘзҗҶи§ЈиҝҮж»ӨеҷЁзҡ„зү№еҫҒпјҡ
Import matplotlib.pyplot as pltImport matplotib.image as mpimgImport cv2Import numpy as npImage = mpimg.imread(вҖҳdog.jpgвҖҷ)Plt.imshow(image)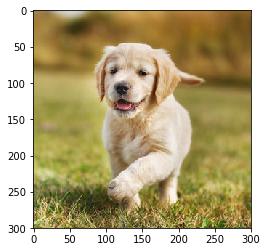 ж–Үз« жҸ’еӣҫ
# иҪ¬жҚўдёәзҒ°еәҰеӣҫgray = cv2.cvtColor(image, cv2.COLOR_RB2GRAY)# е®ҡд№үsobelиҝҮж»ӨеҷЁsobel = np.array([-1, -2, -1],[0, 0, 0],[1, 2, 1]))# еә”з”ЁsobelиҝҮж»ӨеҷЁFiltered_image = cv2.filter2D(gray, -1, sobel_y)# з”»еӣҫPlt.imshow(filtered_image, cmp=вҖҷgrayвҖҷ)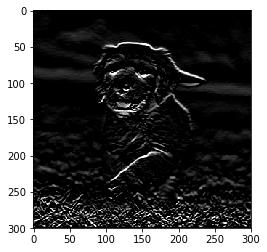 ж–Үз« жҸ’еӣҫ
д»ҘдёҠжҳҜеә”з”Ёsobelиҫ№зјҳжЈҖжөӢж»Өй•ңеҗҺеӣҫеғҸзҡ„ж ·еӯҗ пјҢеҸҜд»ҘзңӢеҲ°жЈҖжөӢеҮәиҪ®е»“дҝЎжҒҜ гҖӮ
е®Ңж•ҙзҡ„CNNз»“жһ„
еҲ°зӣ®еүҚдёәжӯў пјҢ е·Із»ҸзңӢеҲ°дәҶеҰӮдҪ•дҪҝз”Ёж»Өй•ңд»ҺеӣҫеғҸдёӯжҸҗеҸ–зү№еҫҒ гҖӮ зҺ°еңЁиҰҒе®ҢжҲҗж•ҙдёӘеҚ·з§ҜзҘһз»ҸзҪ‘з»ң пјҢ cnnдҪҝз”Ёзҡ„еұӮжҳҜпјҡ
- 1.еҚ·з§ҜеұӮпјҲConvolutional layerпјү
- 2.жұ еұӮ(Pooling layer)
- 3.е…ЁиҝһжҺҘеұӮ(fully connected layer)
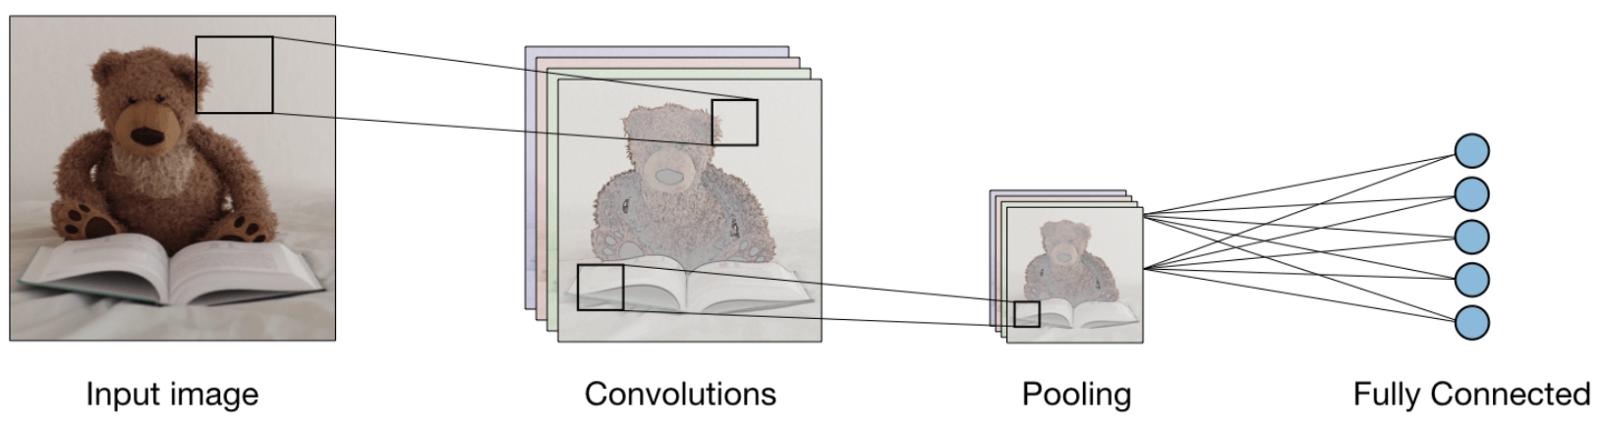 ж–Үз« жҸ’еӣҫ
дёӢйқўи®©жҲ‘们зңӢзңӢжҜҸдёӘеӣҫеұӮиө·еҲ°зҡ„зҡ„дҪңз”Ёпјҡ
* еҚ·з§ҜеұӮпјҲCONVпјүвҖ”вҖ”дҪҝз”ЁиҝҮж»ӨеҷЁжү§иЎҢеҚ·з§Ҝж“ҚдҪң гҖӮ еӣ дёәе®ғжү«жҸҸиҫ“е…ҘеӣҫеғҸзҡ„е°әеҜё гҖӮ е®ғзҡ„и¶…еҸӮж•°еҢ…жӢ¬ж»ӨжіўеҷЁеӨ§е°Ҹ пјҢ еҸҜд»ҘжҳҜ2x2гҖҒ3x3гҖҒ4x4гҖҒ5x5пјҲжҲ–е…¶е®ғпјүе’ҢжӯҘй•ҝS гҖӮ з»“жһңиҫ“еҮәOз§°дёәзү№еҫҒжҳ е°„жҲ–жҝҖжҙ»жҳ е°„ пјҢ е…·жңүдҪҝз”Ёиҫ“е…ҘеұӮи®Ўз®—зҡ„жүҖжңүзү№еҫҒе’ҢиҝҮж»ӨеҷЁ гҖӮ дёӢйқўжҸҸз»ҳдәҶеә”з”ЁеҚ·з§Ҝзҡ„е·ҘдҪңиҝҮзЁӢпјҡ
 ж–Үз« жҸ’еӣҫ
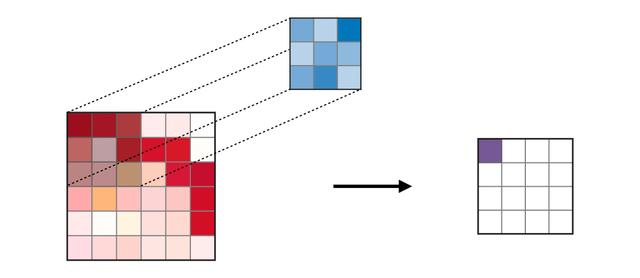
еҚ·з§Ҝиҝҗз®—
- жұ еҢ–еұӮпјҲPOOLпјүвҖ”вҖ”з”ЁдәҺзү№еҫҒзҡ„дёӢйҮҮж · пјҢ йҖҡеёёеңЁеҚ·з§ҜеұӮд№ӢеҗҺеә”з”Ё гҖӮ жұ еҢ–еӨ„зҗҶж–№ејҸжңүеӨҡз§Қзұ»еһӢ пјҢ еёёи§Ғзҡ„жҳҜжңҖеӨ§жұ еҢ–пјҲmax poolingпјүе’Ңе№іеқҮжұ еҢ–пјҲave poolingпјү пјҢ еҲҶеҲ«йҮҮз”Ёзү№еҫҒзҡ„жңҖеӨ§еҖје’Ңе№іеқҮеҖј гҖӮ дёӢйқўжҸҸиҝ°дәҶжұ еҢ–зҡ„е·ҘдҪңиҝҮзЁӢпјҡ
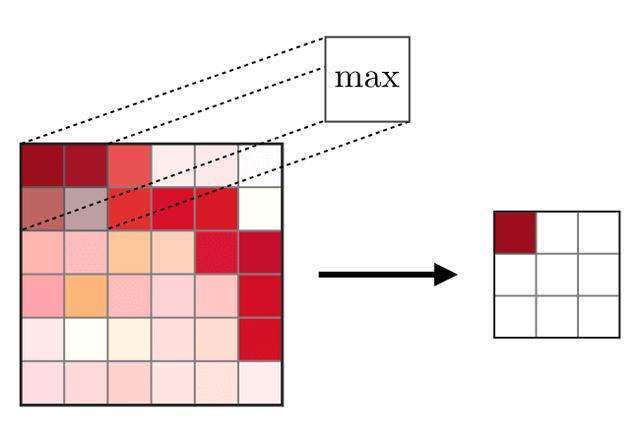 ж–Үз« жҸ’еӣҫ
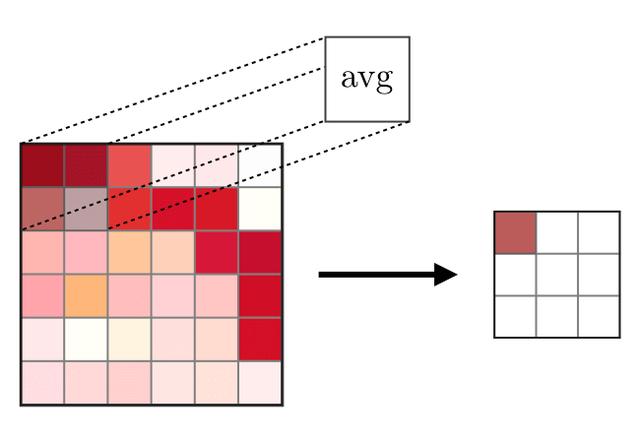 ж–Үз« жҸ’еӣҫ
- ?е…ЁиҝһжҺҘеұӮпјҲFCпјүвҖ”вҖ”еңЁеұ•ејҖзҡ„зү№еҫҒдёҠиҝӣиЎҢж“ҚдҪң пјҢ е…¶дёӯжҜҸдёӘиҫ“е…ҘиҝһжҺҘеҲ°жүҖжңүзҡ„зҘһз»Ҹе…ғ пјҢ йҖҡеёёеңЁзҪ‘з»ңжң«з«Ҝз”ЁдәҺе°Ҷйҡҗи—ҸеұӮиҝһжҺҘеҲ°иҫ“еҮәеұӮ пјҢ дёӢеӣҫеұ•зӨәе…ЁиҝһжҺҘеұӮзҡ„е·ҘдҪңиҝҮзЁӢпјҡ
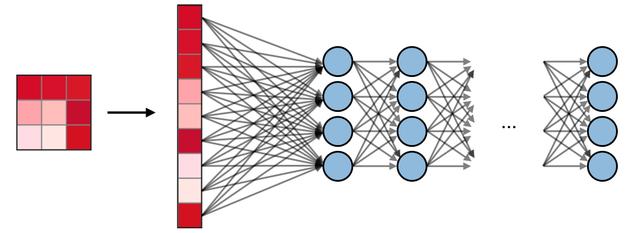 ж–Үз« жҸ’еӣҫ
еңЁPyTorchдёӯеҸҜи§ҶеҢ–CNN
еңЁдәҶи§ЈдәҶCNNзҪ‘з»ңзҡ„е…ЁйғЁжһ„件еҗҺ пјҢ зҺ°еңЁи®©жҲ‘们дҪҝз”ЁPyTorchжЎҶжһ¶е®һзҺ°CNN гҖӮ
жӯҘйӘӨ1пјҡеҠ иҪҪиҫ“е…ҘеӣҫеғҸпјҡ
import cv2import matplotlib.pyplot as plt%matplotlib inlineimg_path = 'dog.jpg'bgr_img = cv2.imread(img_path)gray_img = cv2.cvtColor(bgr_img, cv2.COLOR_BGR2GRAY)# Normalisegray_img = gray_img.astype("float32")/255plt.imshow(gray_img, cmap='gray')plt.show()
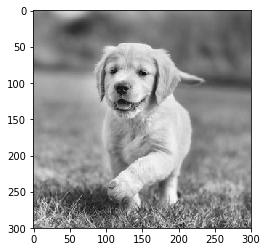 ж–Үз« жҸ’еӣҫ
жӯҘйӘӨ2пјҡеҸҜи§ҶеҢ–иҝҮж»ӨеҷЁ
еҜ№иҝҮж»ӨеҷЁиҝӣиЎҢеҸҜи§ҶеҢ– пјҢ д»ҘжӣҙеҘҪең°дәҶи§Је°ҶдҪҝз”Ёе“ӘдәӣиҝҮж»ӨеҷЁпјҡ
import numpy as npfilter_vals = np.array([ [-1, -1, 1, 1], [-1, -1, 1, 1], [-1, -1, 1, 1], [-1, -1, 1, 1]])print('Filter shape: ', filter_vals.shape)# Defining the Filtersfilter_1 = filter_valsfilter_2 = -filter_1filter_3 = filter_1.Tfilter_4 = -filter_3filters = np.array([filter_1, filter_2, filter_3, filter_4])# Check the Filtersfig = plt.figure(figsize=(10, 5))for i in range(4): ax = fig.add_subplot(1, 4, i+1, xticks=[], yticks=[]) ax.imshow(filters[i], cmap='gray') ax.set_title('Filter %s' % str(i+1)) width, height = filters[i].shape for x in range(width): for y in range(height): ax.annotate(str(filters[i][x][y]), xy=(y,x), color='white' if filters[i][x][y]
жҺЁиҚҗйҳ…иҜ»


- дёүжҳҹеҸ‘еёғж–°з”өи§Ҷпјҡ99.99%еұҸеҚ жҜ” 8Kиҫ“еҮә
- Facebook Messenger收йӣҶзҡ„ж•°жҚ®йҮҸжңүеӨҡеҗ“дәәпјҹеҸҜи§ҶеҢ–еҜ№жҜ”еӣҫе‘ҠиҜүдҪ
- ж•°жҚ®еҸҜи§ҶеҢ–дёүиҠӮиҜҫд№ӢдәҢпјҡеҸҜи§ҶеҢ–зҡ„дҪҝз”Ё
- еҺҶж—¶ 1 дёӘжңҲпјҢеҒҡдәҶ 10 дёӘ Python еҸҜи§ҶеҢ–еҠЁеӣҫпјҢз”Ёеҝғдё”зІҫзҫҺ...
- е…¬зүӣжҺЁеҮәз”өз«һе……з”өеҷЁпјҢ1A1CеҸҢиҫ“еҮәпјҢйӣҶжҲҗиғҪйҮҸе‘јеҗёзҒҜ
- еңЁLinuxзі»з»ҹдёӯе®үиЈ…ж·ұеәҰеӯҰд№ жЎҶжһ¶Pytorch
- дёәдҪ•еӯҰд№ зј–зЁӢеҫҖеҫҖйғҪжҳҜд»Һзј–еҶҷиҫ“еҮәHelloWorldзҡ„зЁӢеәҸејҖе§Ӣ
- MOMAXжҺЁеҮә20W 1A1C PDе……з”өеҷЁпјҢж”ҜжҢҒеҸҢеҸЈиҫ“еҮә
- ж•°жҚ®|еҚ—ж–№з”өзҪ‘и¶…й«ҳеҺӢе…¬еҸёжҲҗеҠҹдёҫеҠһйҰ–еұҠж•°жҚ®еҸҜи§ҶеҢ–еҲҶжһҗеӨ§иөӣ
- 30иЎҢPythonд»Јз Ғе®һзҺ°3Dж•°жҚ®еҸҜи§ҶеҢ–пјҒйқһеёёжғҠиүі